AVM Analysis

Valnow’s unique AVM process calculates a valuation within 15 minutes from start to finish. The tool is an intuitive and user friendly cloud application.

Valnow Valuation

Valnow utilizes multiple powerful artificial intelligence algorithms.

Data is collected, cleaned, enriched, and used to train our models.

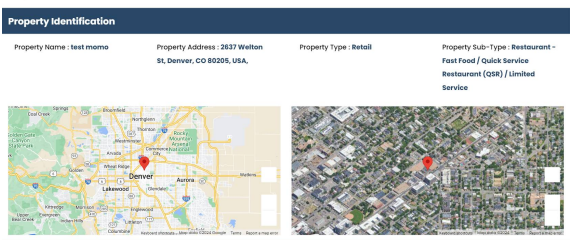
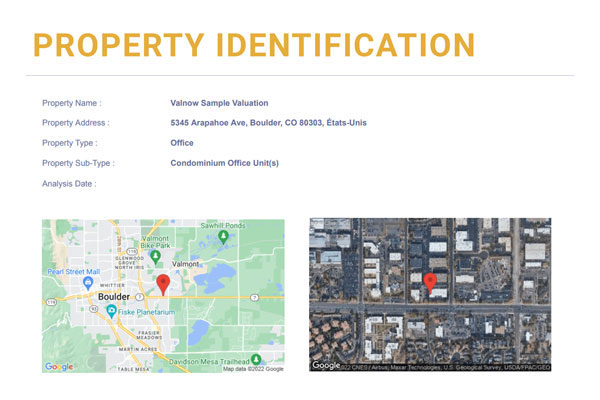
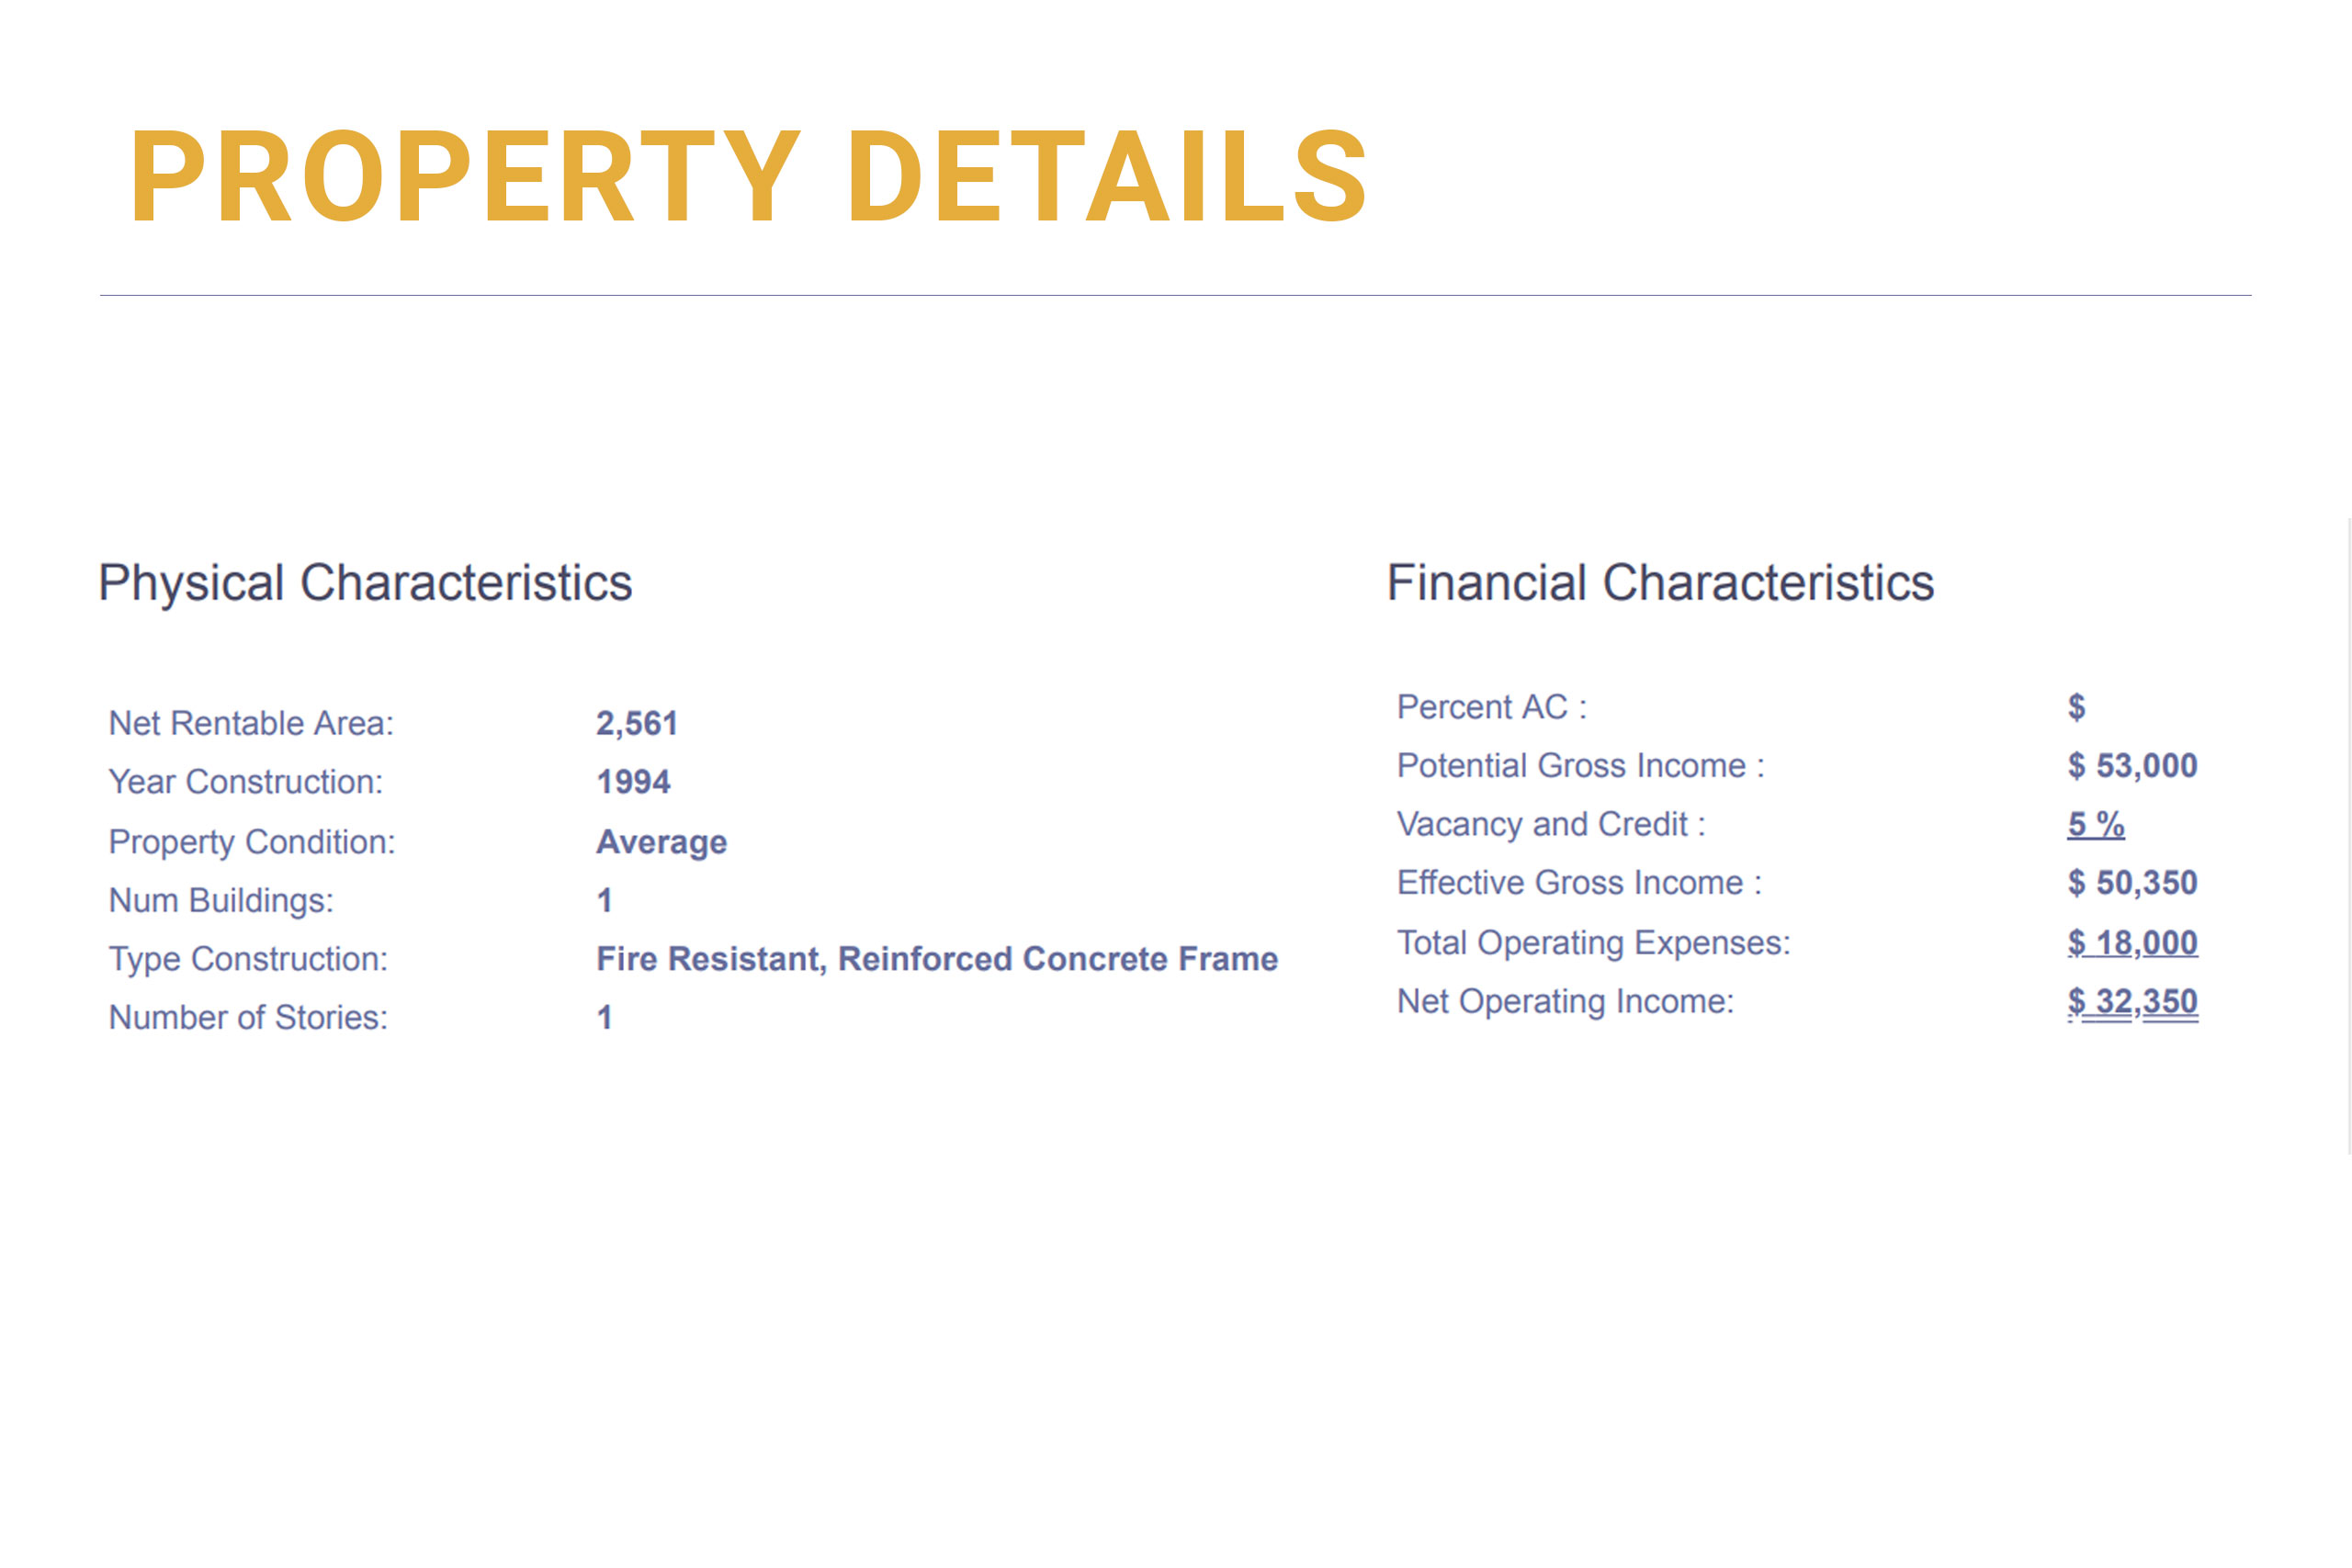
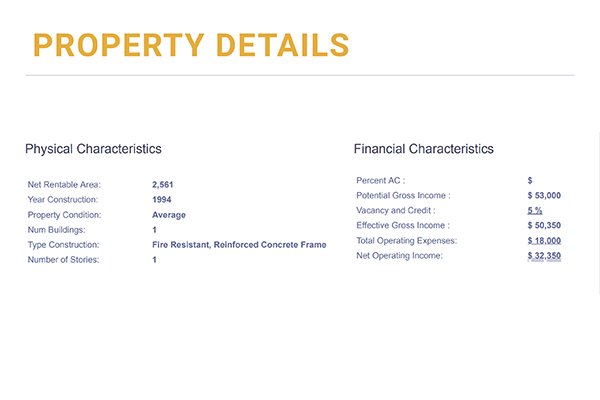
The user enters the subject property address, relevant physical and financial characteristics.

The results are then analyzed and validated prior to presentation to our users.

Property Identification

Property location is verified by Valnow to have an adequate amount of data in the local market to generate a credible result.

Property Details

Data provided by user.

Market Trend Analysis

Valnow calculates average market trends using its AVM (Automated Valuation Model) predictions for properties within a specified Metropolitan Statistical Area (MSA) and state. These values represent estimates as of the final day of the selected time period and are segmented by property type. For Multi-Family properties, indicators are expressed per unit. For Office, Industrial, and Retail properties, metrics are calculated per square foot.

NOI Per Square Foot Analysis

Average Net Operating Income (NOI) trends are derived from actual property transactions within the MSA and state during the selected time period and for the specified property type. The analysis is based on trailing 12-month data. For Multi-Family properties, NOI is presented per unit; for Office, Industrial, and Retail, it is calculated per square foot.

Cap Rate Analysis

Capitalization rate averages are calculated from transactions over the past 12 months in the relevant MSA and property category. To ensure data consistency, minimum and maximum values are constrained within one standard deviation above and below the average cap rate.

Comparable Sales

Comparable sales are selected based on multiple factors, including geographic proximity, net operating income, property type and subtype, year built, and other statistical indicators within the MSA :

  1. Address
  2. Property type/sub property type
  3. Sale price
  4. Sale price per square foot
  5. Net rentable area/number of units
  6. Year of construction
  7. Site size

Confidence Score = Satisfaction Protection

The confidence score is derived from statistical analysis of AI-generated results across similar property types and geographies. It indicates the level of certainty in the valuation provided.

Reliability Analysis

The Reliability Analysis chart illustrates the probability that a Valnow estimate falls within specific error margins compared to actual transaction values. This analysis is based on a detailed review of comparable property transactions within the same Metropolitan Statistical Area (MSA). The chart displays the distribution of estimated transactions across various error ranges. The central bar specifically highlights the percentage of valuations that fall within a ±5% margin of the actual sale price, offering a key indicator of the model's precision.

Value Estimate

The single best point estimate of value and a relevant range of value are presented in absolute dollars and values per square foot.

Markets Analyzed

Once the user provides the subject property address and the property type, Valnow will inform the user if there is sufficient data in the market to provide a credible analysis. Analyses are available for virtually all of the top 100 real estate markets in the United States.

PropertyTypes Analyzed

Valnow analyses four property types :

  1. Multifamily
  2. Industrial
  3. Office
  4. Retail